
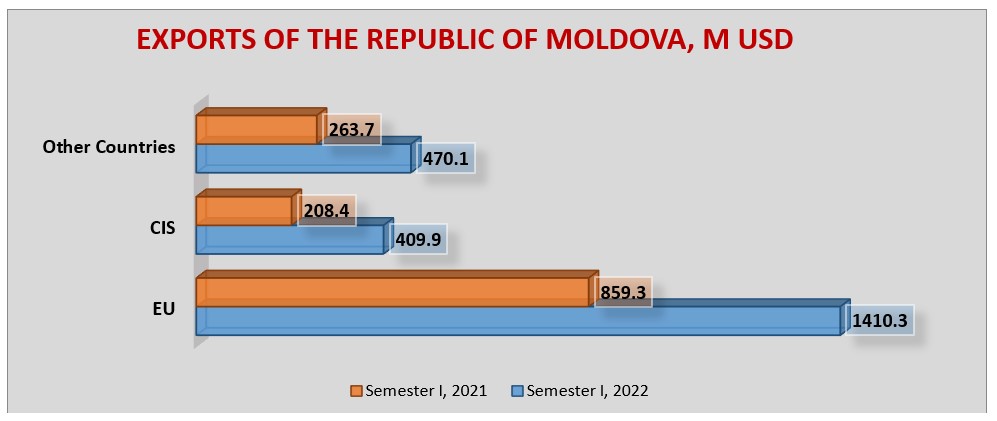
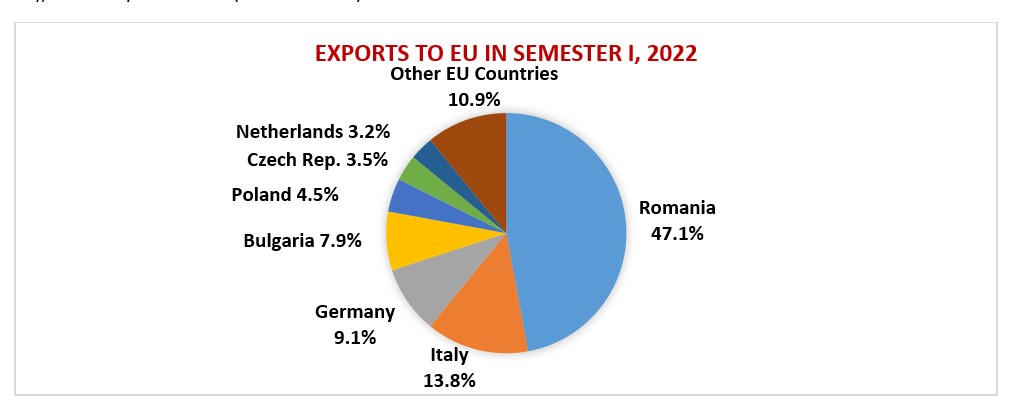
Moldovan exports to the European Union market constituted USD 1 410.3 M and has reached a share of 61.6% of total exports. Compared to January-June 2021, Moldovan exports to EU increased by 64.1%. Out of all Moldovan exports to the EU market, the share of the agri-food products export is 49.5% and the share of industrial products export is 50.5%.
Out of all Moldovan exports to EU, Romania has a share of 47.1% (USD 664.1 M), followed by Italy with 13.8% (USD 194.8 M), Germany with 9.1% (USD 128.9 M) and other EU countries.
Top 10 most exported Moldovan categories of products to EU:
|
No. |
Description |
6 months 2021 (M $) |
6 months 2022 (M$) |
Trend 2022/2021 |
|
|
Electrical machinery and equipment and parts thereof |
285.1 |
274.4 |
-3.7% |
|
|
Oil seeds and oleaginous fruits |
22.4 |
205.9 |
Increase by 9.2 times |
|
|
Animal, vegetable or microbial fats and oils |
32.6 |
174.4 |
Increase by 5.3 times |
|
|
Cereals |
27.4 |
164.4 |
Increase by 6 times |
|
|
Furniture |
83.1 |
79.7 |
-4.1% |
|
|
Articles of apparel and clothing accessories |
60.3 |
66.6 |
+10.4% |
|
|
Edible fruit and nuts |
34.7 |
48.7 |
+40.3% |
|
|
Glass and glassware |
28.1 |
47.4 |
+68.7% |
|
|
Vehicles other than railway or tramway rolling stock |
26.2 |
43.3 |
+65.3% |
|
|
Beverages, spirits and vinegar |
39.4 |
43.2 |
+9.6% |
Moldova’s Imports from EU
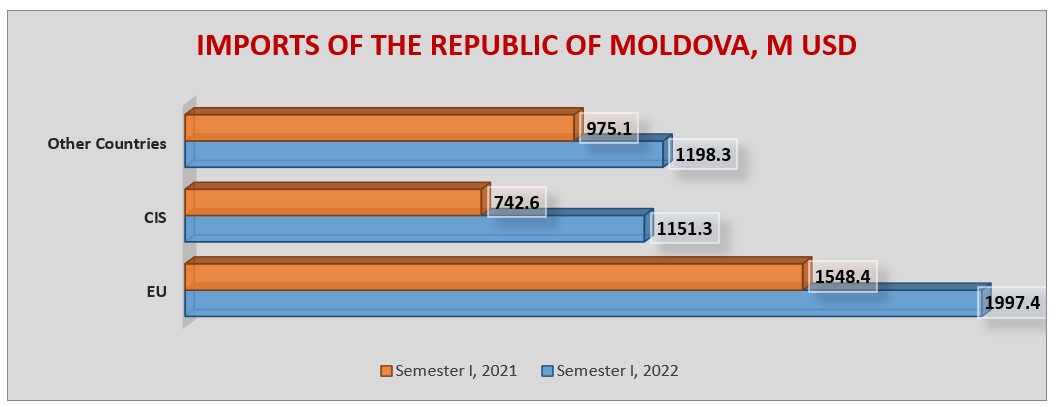
In January – June 2022, Moldova’s imports from EU reached an amount of USD 1 997.4 M which represents a share of 45.9% of total Moldovan imports. Compared to January-June 2021, Moldovan imports from EU increased by 29%.
Out of all Moldovan imports from the EU market, the share of the agri-food products is 15.6% and the share of industrial products is 84.4%.
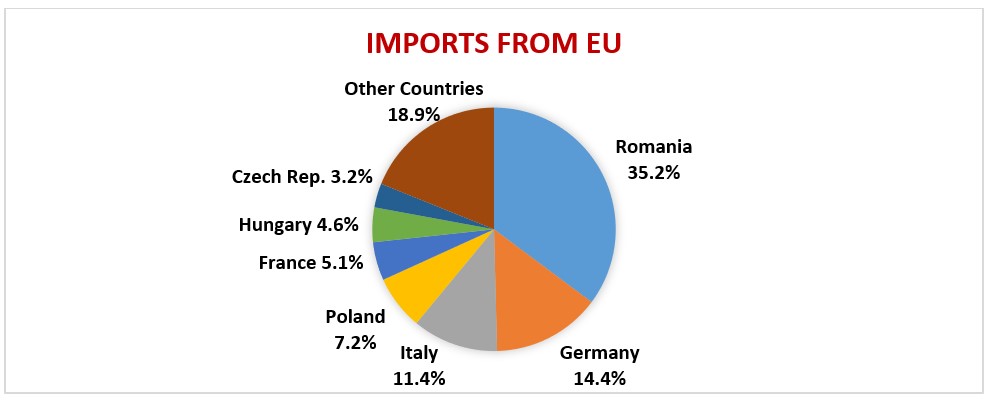
Out of all Moldovan imports from EU, Romania has a share of 35.2% (USD 702.5 M), followed by Germany with 14.4% (USD 287.7 M), Italy with 11.4% (USD 228.2 M), Poland with 7.2% (USD 145.1 M) and other EU Countries.
Top 10 most imported Moldovan categories of products from EU:
|
No. |
Description |
6 months 2021 (M $) |
6 months 2022 (M$) |
Trend 2022/2021 |
|
|
Mineral fuels, mineral oils and products of their distillation |
216.0 |
482.7 |
Increased by 2.2 times |
|
|
Electrical machinery and equipment and parts thereof |
152.1 |
165.9 |
+9.1% |
|
|
Vehicles |
118.6 |
160.3 |
+35.2% |
|
|
Nuclear reactors, boilers, machinery and mechanical appliances |
125.9 |
138.9 |
+10.3% |
|
|
Plastics and articles thereof |
96.4 |
99.3 |
+3% |
|
|
Paper and paperboard |
96.4 |
99.3 |
+3% |
|
|
Pharmaceutical products |
92.5 |
87.6 |
-5.3% |
|
|
Miscellaneous chemical products |
55.9 |
68.3 |
+22.2% |
|
|
Dairy produce; birds' eggs; natural honey |
24.9 |
30.4 |
+22.1% |
|
|
Meat and edible meat offal |
13.2 |
28.3 |
Increased by 2.1 times |

Acest website a fost elaborat cu asistența Uniunii Europene în cadrul proiectului “Suport pentru Cadrul Infrastructurii Calității în contextul DCFTA în Republica Moldova” și este susținut de proiectul Uniunii Europene ”Comunicare Strategică și Suport pentru Mass Media”